
This project was created as part of a larger project to devise a plan for much-needed rapid transit expansion in the NYC metro area. I needed a way to estimate rapid transit ridership at any location within the region in order to statistically support decisions — like station locations, route alignments, and proposed service frequencies — within the plan.
I developed a multiple regression model in Python, based on realistically available parameters: population density, job density, distance to Midtown Manhattan, the amount of service the station receives or might receive, whether it is a terminus station, whether it’s ADA accessible, and whether it’s a “commuter” station (a station with a transfer to commuter rail or a bus terminal, for example).
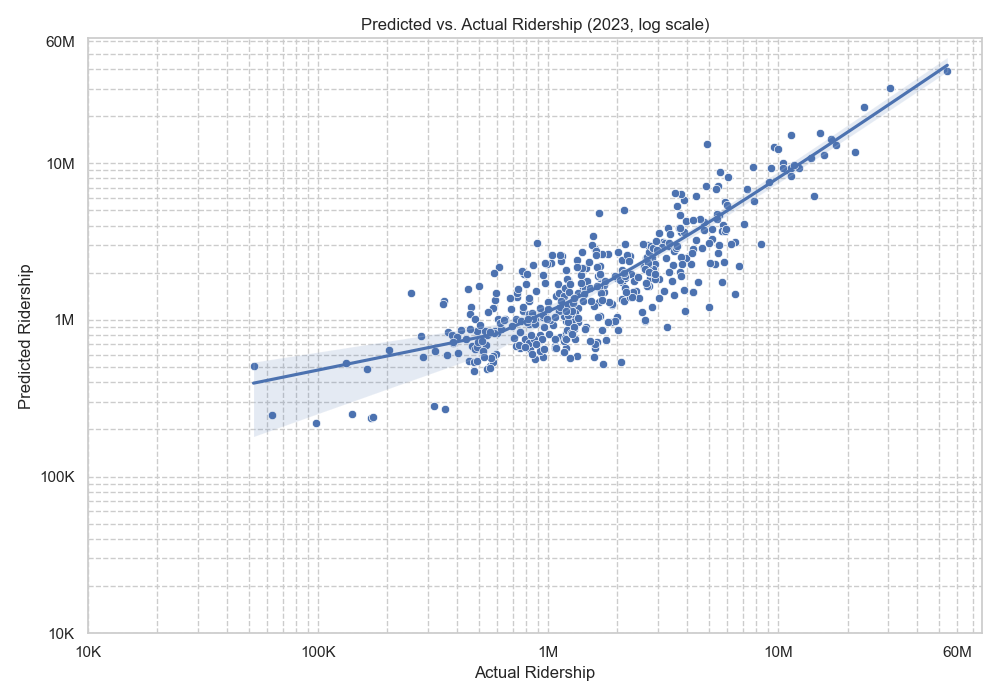
The final model explained ~70% of variation in NYC subway ridership, identifying strong relationships between accessibility, land use, and transit demand.
Findings
- Increased service frequency is strongly correlated with greater ridership. The regression results indicate that a 1% increase in frequency at a station is associated with a ~0.79% increase in ridership. However, this isn’t purely causal. Increasing service to a station will likely boost ridership due to the convenience factor, but at the same time, a station might be allocated more service because of other factors that boost ridership.
- Ridership tapers off sharply as distance from Midtown Manhattan increases.
- Greater job concentration boosts ridership. The regression results indicate that a 10% increase in job density is associated with a ~1% increase in ridership.
- ADA-accessible stations tend to have greater ridership. However, because the MTA has historically focused on important and high-ridership stations for accessibility retrofit projects, there is not strong causality.
- Terminal stations have ~57.5% greater ridership than equivalent non-terminal stations. These stations are often major multi-modal transfer points, collecting riders from a far greater catchment area than the typical rapid transit station, leading to increased ridership.
- Commuter-categorized stations see ~30 times greater ridership than equivalent non-commuter stations. These stations, which serve as transfer points between rapid transit and commuter-oriented modes (like the LIRR, Metro-North, and NJ Transit), are regional hubs and act as gateways to New York City and its rapid transit system. They draw in riders from wide swaths of the metropolitan area (and even the country via intercity Amtrak services), resulting in massive ridership numbers.
- The effect of population density in the area surrounding a station on ridership — while statistically significant—is less substantial than expected.
Insights
- Ridership is incredibly centralized due to both the structure of New York’s rapid transit system and the spatial layout of the city. Expanding service in peripheral areas — with extensions of existing lines as well as orbital and crosstown lines — could decentralize the system and unlock new sources of ridership.
- High ridership at multi-modal/transfer stations — ones with major transfers to buses, commuter and intercity rail, or other rapid transit lines — suggests that these attributes should be prioritized in future planning. For example:
- Design new lines in conjunction with feeder bus networks that bring riders to well-integrated transfer points at the lines’ stations. This increases the stations’ catchment areas, improving overall access.
- When planning a line’s alignment and station locations, prioritize transfer points where the route intersects with other transit lines, major bus corridors, or key commuter and intercity rail services. This enhances regional connectivity and encourages higher ridership by making transfers easy and efficient.
- Land use in areas surrounding stations significantly impacts ridership. Development that supports transit ridership, like dense housing and commercial spaces, can help maximize use. Zoning policy should enable more people to live and work within easy access to rapid transit.
Plots

Sources
- MTA 2023 Subway Ridership Data
- MTA Subway Stations (NY Open Data)
- American Community Survey 5-Year Data
- LEHD Origin-Destination Employment Statistics (LODES) Workplace Area Characteristics (WAC) Data
- NYC Subway Frequencies (Gregory Feliu)
